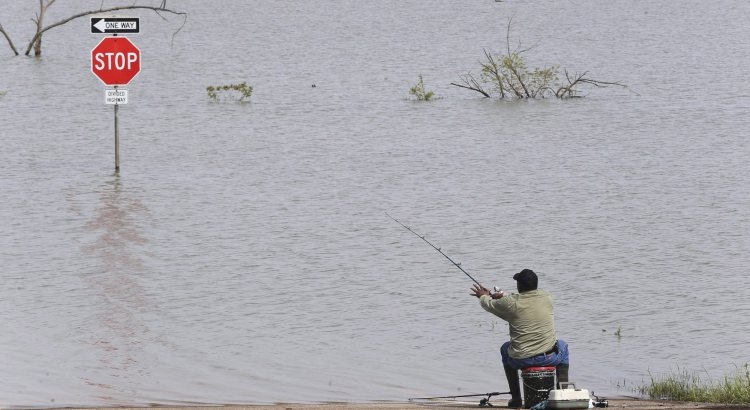
Photo credit: John Badman/The Telegraph via AP
By: Michael Wolfson
The tornadoes that recently hit the Ottawa area cannot be blamed specifically on global climate change. But they are consistent with the long-predicted pattern of increasingly frequent and severe extreme weather events, highlighted in the most recent report of the International Panel on Climate Change.
Unfortunately, too many Canadians still do not believe that human activity is a major contributor to climate change. How media and government agencies report weather forecasts could help change that.
Environment and Climate Change Canada, a government agency, and a bevy of meteorologists provide regular weather forecasts to Canadians through traditional and social media. But they don’t often tell us how our daily weather fits, or doesn’t fit, with climate change. We hear each day how hot or cold it will be tonight; whether to expect rain tomorrow; and what the UV index will be. And on TV, we often see maps of Canada showing animated radar images of cold and warm fronts, clouds, temperatures, cyclones and where there is rain or sun.
This information is always helpful to decide what to wear and whether to bring an umbrella. But the government agencies and weather forecasters are missing a major opportunity to impart data that could help to educate and remind Canadians of the growing impacts of climate change on our daily lives.
The most we typically hear about climate trends is whether this was the hottest or coldest day/weeks/months on record. But these trivial facts don’t give us a deeper understanding of the impacts of climate change in our own regions of Canada.
There are interesting and highly relevant weather statistics that would fit well with daily weather forecasts and could regularly remind us that climate change is real, that it is happening now, and could demonstrate how it is affecting our daily lives. Instead of simply pointing out daily or monthly weather records, for example, the forecasts could include the frequency of highly unusual or extreme weather events, statistics that demonstrate broader climate change trends.
Depending on the actual daily weather patterns in your part of the country, forecasts could include, for example, exceptional runs of high wind speeds, extreme downpours and unusually warm winter low temperatures, using comparisons with historic patterns. These kinds of statistics may look similar to the ones we hear now, but they are different – they flag when and where unusual or extreme weather patterns are happening.
Another routinely collected kind of weather data that is rarely shared with the public is snow cover — a critical input for Environment and Climate Change Canada’s weather forecasting models. Similar to the shrinking coverage of the Arctic ice cap and receding glaciers, why not demonstrate once in a while how today’s snow cover across Canada compares to averages on the same day spanning a previous decade?
Scientists studying global climate change have predicted for decades that in addition to gradual warming, the most noticeable effects will be increasing frequencies of extreme weather events – hotter and longer heat waves, heavier and more intense downpours, and depending on which part of Canada it is, longer and more intense dry spells.
Canada will also be affected by melting Arctic sea ice, melting permafrost, ocean acidification, more forest fires and rising seas. Climate change is also predicted to generate more intense hurricanes and typhoons in other parts of the world. These changes, while tremendously important, do not fit well with daily weather forecasts.
But it would be easy for Environment and Climate Change Canada to produce an interesting and engaging flow of statistical indicators – weather facts and images — that highlight climate changes that affect us, not just whether it will be warm and sunny tomorrow. Our regular TV and radio weather forecasters could then be able to inform their audiences that we’re in the midst of an unusual or extreme weather event, as they occur, using these new and much more important indicators.
Inevitably, as global climate change continues, the frequency that these indicators would show important changes, especially extreme changes, will increase. Why doesn’t the Minister of the Environment and Climate Change ask her staff to produce this information for Canadians? It could help us all understand the here and now of climate change in real terms.
Michael Wolfson is a member of the Centre for Health Law, Policy and Ethics at the University of Ottawa and a Contributor with EvidenceNetwork.ca based at the University of Winnipeg. He was a Canada Research Chair at the University of Ottawa. He is a former assistant chief statistician at Statistics Canada.

